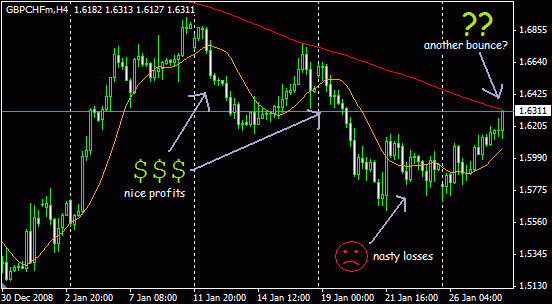
Now it looks like another bounce can happen again. Look at the chart below and you'll see what I'm talking about. If you turn on the EA right now in anticipation of either a bounce or a break through the 200MA, there is a good chance you'll make a few bucks over the next few days or even weeks. Note that the AME Cross Trader will not place any trades until that 12MA is between the 200MA and price, which should be happening in the next few days. So now would be a good time to turn it on and let it wait for the opportunity to come.
Here are the parameters I am using on my chart.
minTradeSize = 0.1 (0.01 for standard account)
scaleDivisor = 100 (1000 for FXDD)
stopDollars = 1000
shortMaBars = 12
longMaBars = 200
stopBars = 6
useLimit = 1
limitPips = 10
useMM = 1
aggressiveMode = 1
slippage = 10
panicMode = 0
maxTotalLots = 1000
Also, note on that chart the short consolidation period that happened right before the price started moving towards the 200MA. Unfortunately, I took some pretty bad losses during this time. Part of it was a manual trade that I placed which went against me. But overall it was a confusing period for the AME Cross Trader. If you look at the 12MA, you'll notice that it is nearly horizontal and the price crosses back and forth over it. This is the worst time to trade, but I ignored my better instincts and let it go anyway, and it cost me all of my profits and a little more.
Now I have some catching up to do. Oh well.

No comments:
Post a Comment